Per-Star Metrics Plot
This is a "per-star" plot that shows metrics for individual stars, averaged over the ensemble. Each star appears as a point in distance-luminosity coordinates. Various star-by-star metrics can be chosen as shading and tooltips within the scatter plot.
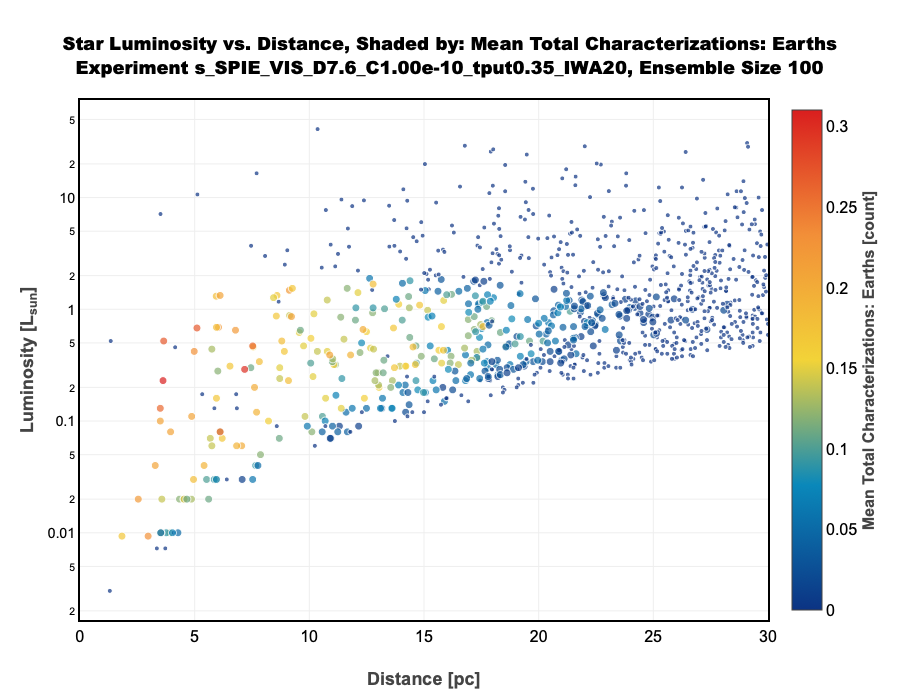
There is one plot panel for detections and one for spectral characterizations -- this page describes both. Generally the two panels have available parallel quantities for detections versus characterizations.
Format
The "QOI," or Quantity of Interest, is chosen from a dropdown menu. Each QOI is a scalar that is used to color the point corresponding to a given star, and to display on tooltips upon the point.
Stars are shown in a scatterplot format, with distance on x and luminosity on y. Points come in two sizes: larger points correspond to stars that were observed at least once in the ensemble, and smaller points are in the target list but were not observed.
Different QOIs have different colorbars, and units are given next to the colorbar. In general, QOIs involving integration time are shown on a log (base 10) scale. Not-a-numbers will be shown in gray. For instance, the cumulative integration time of an unobserved star is 0, and the log of this is taken to be a not-a-number and shown in gray.
Tooltips
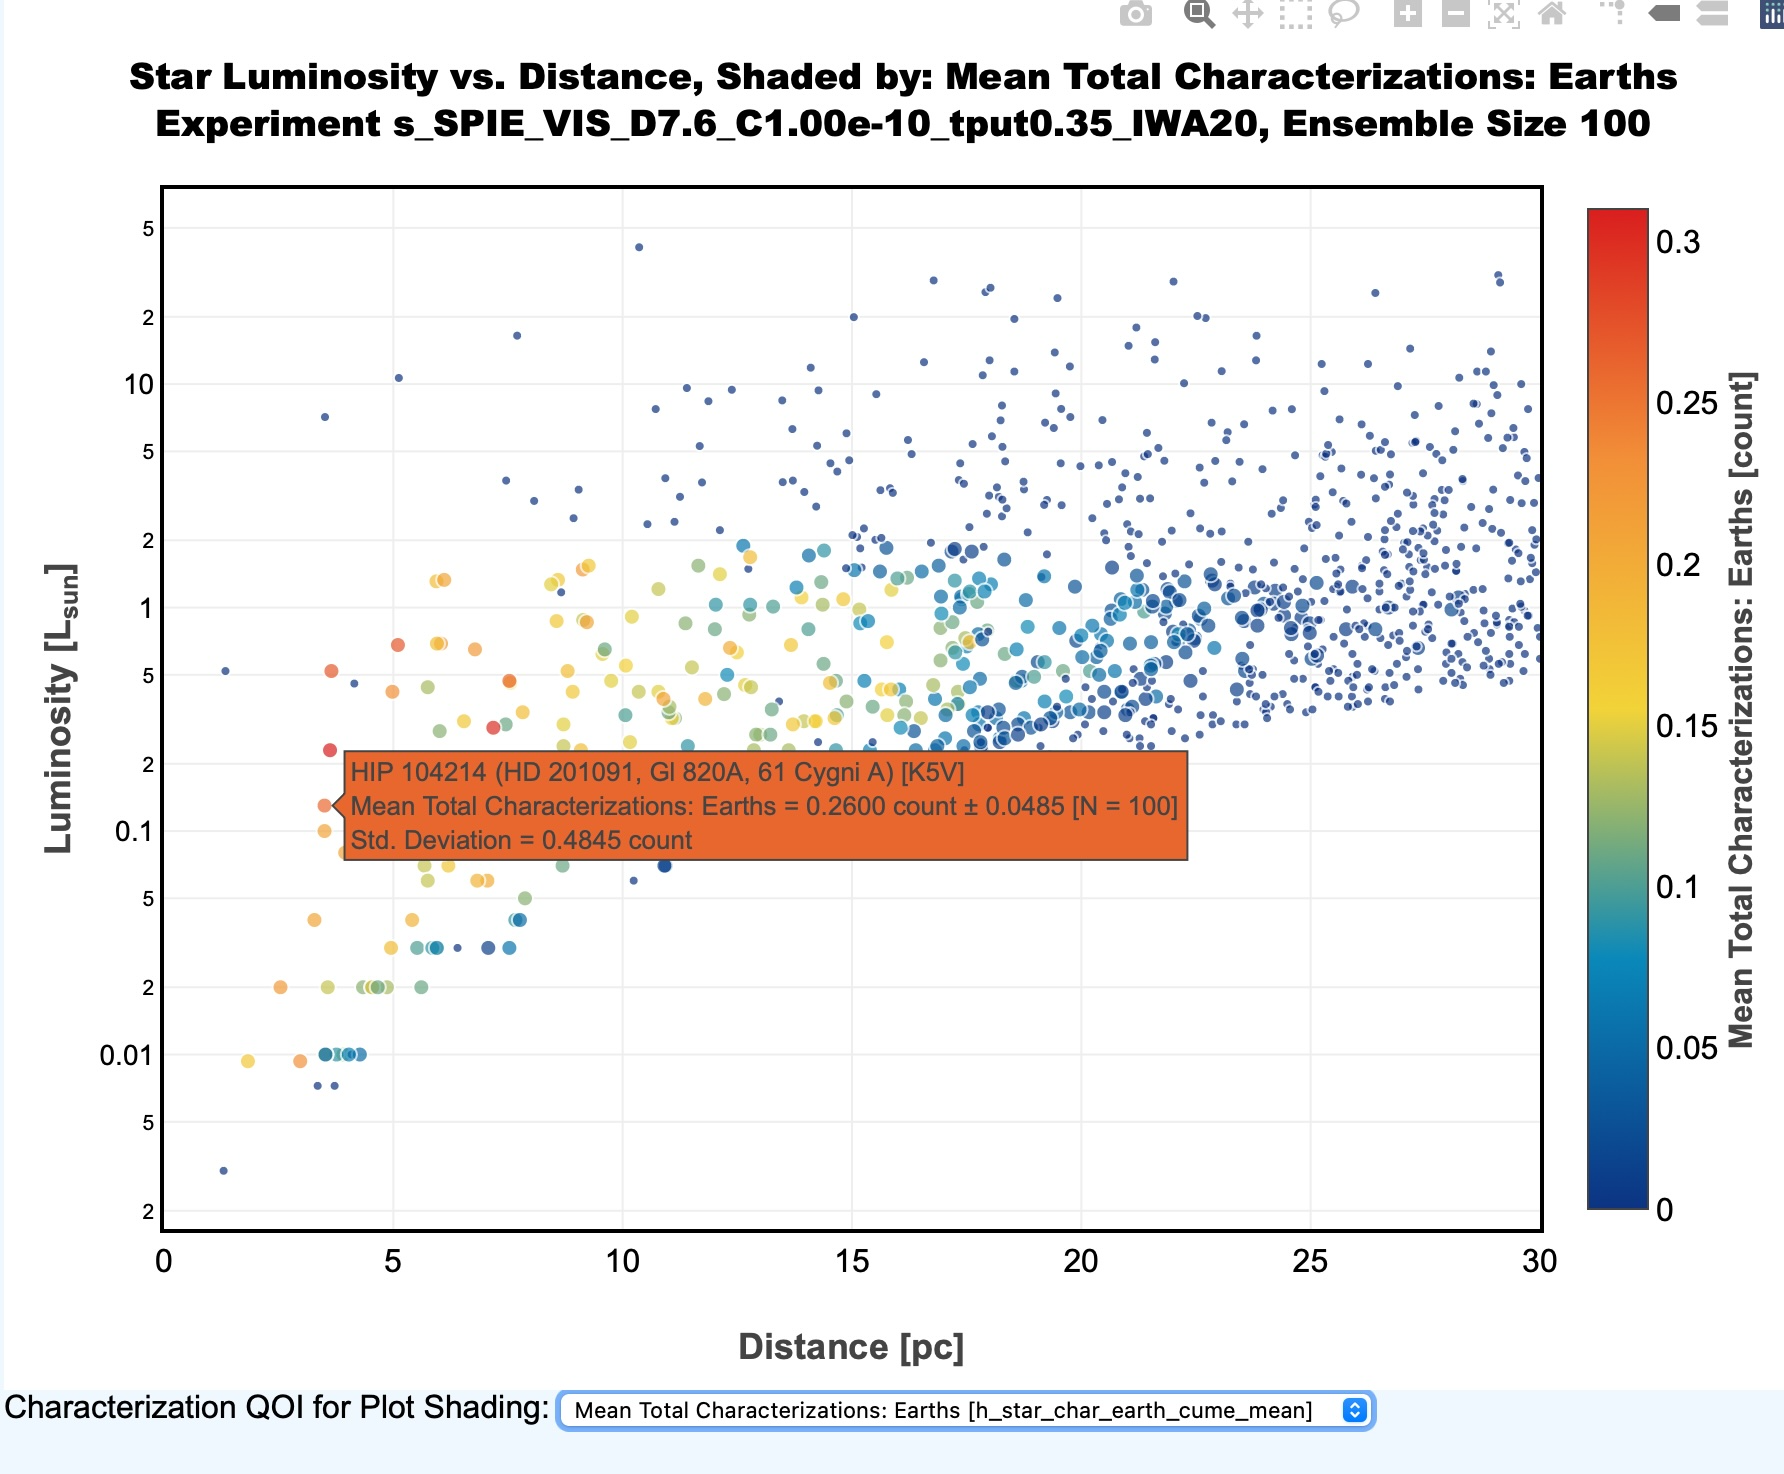
Brushing your cursor over the points indicating stars puts up a panel showing:
-
Hipparcos name, with: (other alternative names in parentheses)
-
Stellar class, in []
-
QOI mean value: always a mean M over the ensemble
-
The standard error of this mean value (M ± SE)
-
Ensemble size N
-
Standard standard deviation S (over the ensemble)
The standard error (SE) quantities after ± are the standard error of the mean. That is, SE is the population standard deviation S divided by the square root of ensemble size (SE = S/√N), so SE will drop to zero as ensemble size N grows. The intent is to show how accurate the shown average is.
Note that some QOIs are not computable for every ensemble member, and this is accounted for correctly in the displayed mean M and the ensemble size N.
For instance, the QOI "Earths Characterized/Earths Present" is not defined (0/0) for ensemble members with no Earthlike planet around that target star. So, depending on η-Earth, a 100-member ensemble might have only 21 values of this QOI to average, and the tooltip will reveal the relevant N = 21, so that the uncertainty of the underlying average will be more clear.
Quantities of Interest
We emphasize that all quantities are averages over the ensemble of the indicated metric (or QOI).
Thus, reported QOIs are always a mean value, but we do not repeat this in the description.
So, "Detection Visits" should be interpreted as, "mean value, over the N-member ensemble, of the number of detection visits to that star."
Detection Panel
| QOI Name | Unit | Short Name | Description |
|---|---|---|---|
| Completeness | count | det_comp_mean |
First-visit completeness (det. obs. mode) |
| Total Detections: Earths | count | det_earth_cume_mean |
Includes repeat visits |
| Earths Detected/Earths Present | count/count | det_earth_frac_mean |
Mean of: (successful/present) ≤ 1 |
| Unique Detections: Earths | count | det_earth_uniq_mean |
Repeat visits uncounted |
| Earth Detection Rank | count/day | det_earth_value_mean |
Detections/Integration time |
| Total Detections | count | det_plan_cume_mean |
Includes repeat visits |
| Planets Detected/Planets Present | count/count | det_plan_frac_mean |
Mean of: (successful/present) ≤ 1 |
| Unique Detections | count | det_plan_uniq_mean |
Repeat visits uncounted |
| Detection Rank | count/day | det_plan_value_mean |
Mean of: (detections/integration time) |
| One-visit Integ. Time | day | det_tIntAvg_mean |
Average single-visit integration time |
| Cumulative Integ. Time | day | det_tInt_mean |
Total time spent on detection |
| First Observation Time | day | det_tobs1_mean |
Mission time of first detection visit |
| Detection Visits | count | det_visit_mean |
Visits or revisits to the star |
| Earths per Star | count | earth_per_star_mean |
Earthlike planet count |
| Planets per Star | count | plan_per_star_mean |
Planet count |
| Promotion Rate: Stars with Earths | count | promo_earth_mean |
Fraction promoted when hosting Earthlike planet |
| Promotion Rate: Stars with HZ Planets | count | promo_hzone_mean |
Fraction promoted when hosting HZ planet |
| Promotion Rate | count | promo_allplan_mean |
Fraction of missions where the star was promoted |
| Earths per Star | count | earth_per_star_mean |
Earthlike planet count |
| Planets per Star | count | plan_per_star_mean |
Planet count |
Characterization Panel
| QOI Name | Unit | Short Name | Description |
|---|---|---|---|
| Completeness | count | char_comp_mean |
First-visit completeness (char. obs. mode) |
| Total Characterizations: Earths | count | char_earth_cume_mean |
Includes repeat visits |
| Earths Characterized/Earths Present | count/count | char_earth_frac_mean |
Mean of: (successful/Earth present) ≤ 1 |
| Unique Characterizations: Earths | count | char_earth_uniq_mean |
Repeat visits uncounted |
| Earth Characterization Rank | count/day | char_earth_value_mean |
Mean of: (yield/cume. int. time) |
| Total Characterizations | count | char_plan_cume_mean |
Includes repeat visits |
| Planets Characterized/Planets Present | count/count | char_plan_frac_mean |
Mean of: (successful char./planet present) |
| Unique Characterizations | count | char_plan_uniq_mean |
Repeat visits uncounted |
| Characterization Rank | count/day | char_plan_value_mean |
Mean of: (char. yield/cume. int. time) |
| One-visit Integ. Time | day | char_tIntAvg_mean |
Average single-visit integration time |
| Cumulative Integ. Time | day | char_tInt_mean |
Total time spent on characterization |
| First Observation Time | day | char_tobs1_mean |
Mission time of first characterization visit |
| Characterization Visits | count | char_visit_mean |
Visits or revisits to the star |
| Earths per Star | count | earth_per_star_mean |
Earthlike planet count |
| Planets per Star | count | plan_per_star_mean |
Planet count |
Notes
Notes on specific metrics:
-
For detection and characterization, the completeness is constant across the ensemble.
-
"Rank" metrics (both characterization and detection) are patterned after the typical scheduler prioritization of yield divided by integration time. They are the ensemble average of the number of successful observations, divided by the cumulative integration time (see below) spent on that observation.
-
The "cumulative integration time" is the ensemble mean of the cumulative time spent across all detection (resp., characterization) observations on that star. This metric measures how much time overall we spend on a particular star.
-
The "one-visit integration time" is the ensemble mean of the per-DRM mean of the time spent collecting light across all detection (resp., characterization) visits to that star (successful or not). This metric measures how long we typically integrate on a single visit to the star.
-
"First observation time" is a tool to reveal stars we typically observe early in the mission, or stars we only get to much later on.
-
"Detected/Present" metrics are responsive to observing system and scheduler efficiency: are we able to find planets around this star?
-
"Planets per Star" and "Earths per Star" are not a function of observing system. They are present to allow a check of the
SimulatedUniverse.
Provenance
The values of these metrics
can be refreshed by just reducing the data (make ... reduce)
and re-loading the webpage.
They are computed in reduce_drms.py:per_star_yield(),
which writes the averages to reduce-star-target.csv, which is in turn picked up
by a JavaScript loader within star-target-plots.js.