Observation Timelines
We make plots of observations (integration intervals) versus time, across the whole mission.
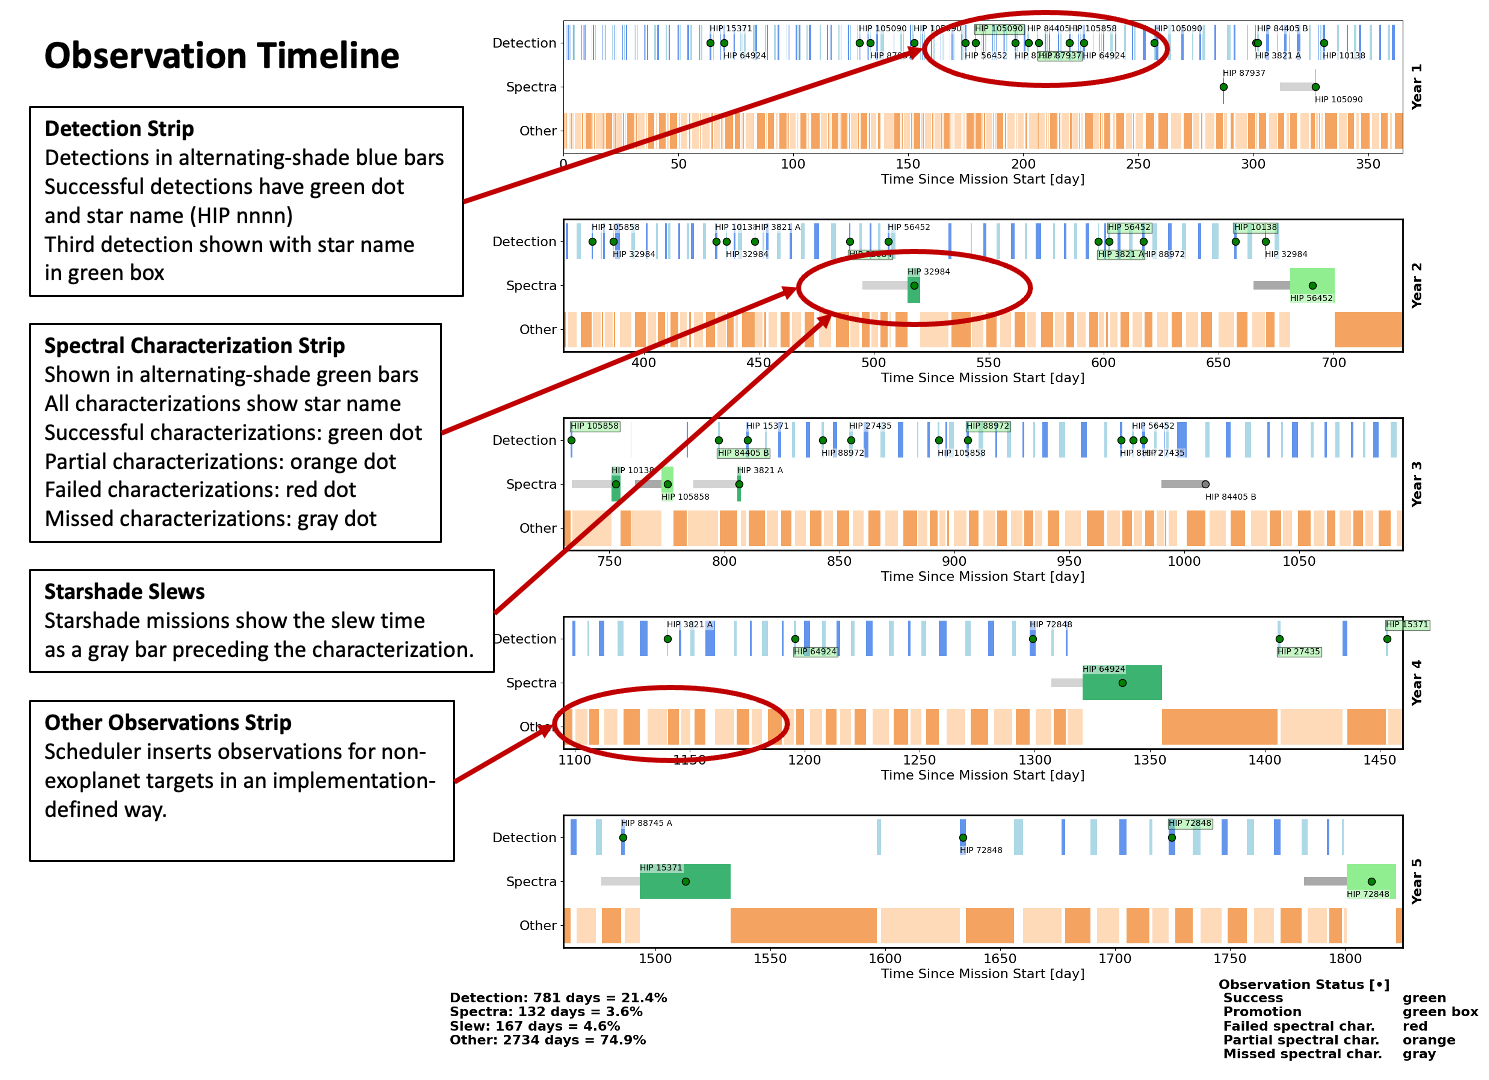
Plot Format
Mission elapsed time is along the x-axis, and observation type is on the y-axis. The latter can be Detection, Spectral Characterization, or Other observations such as general astrophysics. We can show 5 years on one page, and further years appear on separate pages.
In general, we are showing available integration intervals.
Detections
Detection observations are shown in alternating shades of blue. The two shades have no intrinsic meaning, it is just a mechanism to prevent a series of back-to-back observations from blurring together.
Many detections do not find a planet, but the ones that do are shown as a green dot with the corresponding star name in a small text box. If this is the third successful detection, the star name is shown in a green box to indicate it could be a promotion target (depending on script settings). Boxes alternate above and below the centerline to minimize overprinting.
Detections that do not find a planet do not receive a dot.
Spectral Characterizations
Much like Detections, Characterizations are shown by alternating green bars with text boxes. Text boxes alternate above and below the centerline to minimize overprinting. Being relatively sparse, more information can be provided, as follows:
| Dot Color | Short Name | Description |
|---|---|---|
| Green | Success | Successful characterization (full spectrum) |
| Orange | Partial | Partial characterization (IWA/OWA issue) |
| Red | Fail | Failed characterization (poor SNR) |
| Gray | Miss | Missed characterization (e.g., unexpected keepout violation) |
Missed characterizations can happen due to a scheduler problem in which an observation is attempted that has a keepout conflict.
General Astrophysics
Depending on mission configuration, general astrophysics (GA) observations may be shown in orange underneath exoplanet-related observations. GA observations must not overlap the other observation types. They are interleaved using an arbitrary scheduler-dependent mechanism.
Slews
Missions with a starshade will have narrower gray bars, representing slew intervals, appearing ahead of the green bars for spectral characterization. Detection and general astrophysics observations may take place concurrently with slews.